|
Stay tuned for step by step description on how to carry out regionalization with SOM or explore the scripts yourself (posted at the bottom of this page).
|
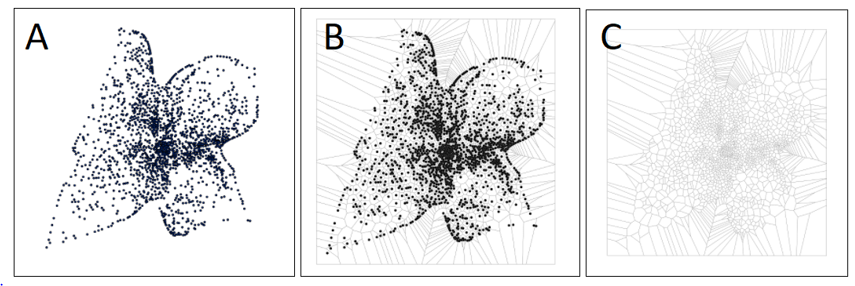
Figure 1 A) GeoSOM nodes. B-C) Thiessen polygons built around each node.
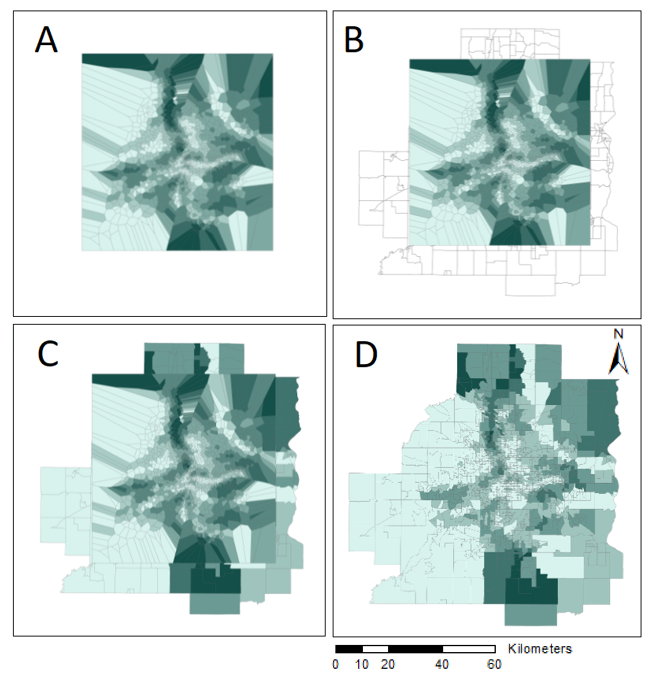
Figure 2. A) Thiessen polygons each assigned the u-mat value of the node that falls within it. B) Thiessen polygons projected onto a map of the Minneapolis metro area. C) U-matrix values transposed onto the map surface by assigning the u-matrix value of the Thiessen polygon to the block group whose centroid falls within it. D) Final u-matrix map at the block group level.
|
This animation to the left shows the variation in the placement of nodes between GeoSOM executions when using the same data and same parameters. The animation to the right shows the variation in u-mat values between multiple executions.
|
|
|
SOM2Map.R is a R script that processes GeoSOM output into a shapefile that can be used as input for various regionalization procedures.
MSOM is a regionalization procedure that relies on Max P Regions ClusterPy (Duque, Dev, Betancourt, & Franco, 2011) to create partitions based on SOM u-matrix values.
|
